The PEO advantage

This archived material is for informational purposes only; the information provided was accurate at the time of publication but may no longer be current.
This archived material is for informational purposes only; the information provided was accurate at the time of publication but may no longer be current.
This report from Guardian's 11th Annual Workplace Benefits Study looks at the PEO industry today and the advantages that employers are experiencing from working with them.
Guardian Edge is your resource for the latest insights on workplace trends
What is a PEO?
More than benefits, it’s a full HR outsourcing solution
When most people think of professional employer organizations (PEOs), they think benefits. While it’s true that membership in a PEO can be an effective way for employers, especially smaller ones, to offer employees a larger pool of benefits at a lower cost, PEOs offer more than employee benefits.
PEOs also provide support with human resources administration, including payroll taxes and reporting requirements. This frees up HR managers to focus on supporting their employees in other ways, like strengthening their benefits technology and communication strategies. In effect, PEOs can serve as an outsourced HR department for employers.
This report examines the growth of the PEO industry, how employers are using them, and the advantages they’ve experienced from working with them. In an environment of “quiet quitting,” and as the hiring market picks up post-COVID, employers are keen to offer as competitive a benefit package as possible while controlling costs. Evaluating whether PEO membership may be right for them could be a key part of that strategy.
PEO utilization among small businesses has expanded over the past decade
According to the National Association of PEOs (NAPEO), the estimated overall PEO industry penetration rate is 11% across all businesses with 10-99 employees.1 The number of employers using PEOs has grown about 40% since 2008, when only about 7.85% of employers with 10-99 workers used a PEO.2
The number of employers joining PEOs may be poised to grow even more in the coming years. Through an increase in remote work and businesses being more open to hiring remote employees, the pandemic increased many firms' geographic footprint. The more states employers have workers in, the likelier they are to use a PEO. Twenty-five percent of employers with workers in 10 or more states use a PEO compared to 11% of employers with workers in five to nine states.
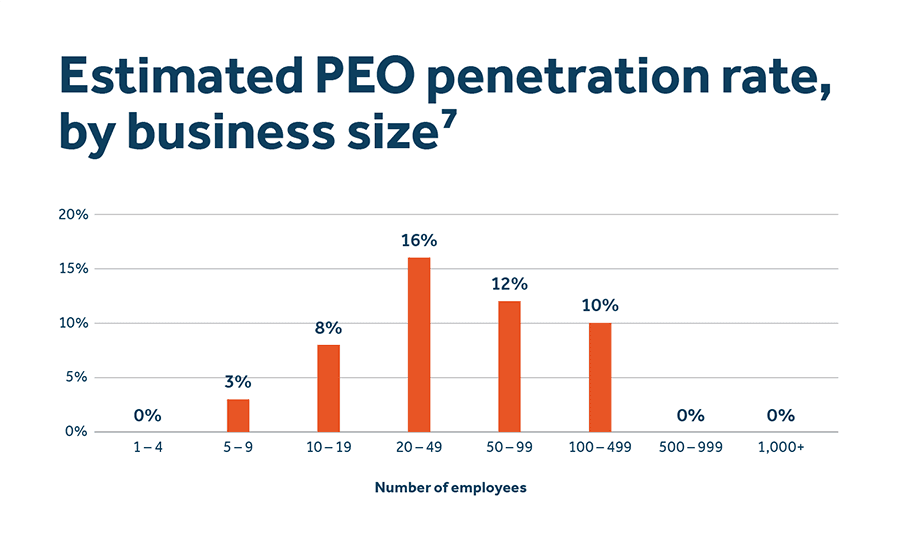
While firms of any size can join a PEO, PEOs are mostly geared toward small to midsize businesses because of the cost savings they gain from the PEO’s scale of economy. Indeed, the estimated PEO penetration rate is highest (16%) among firms with 20-49 employees.3
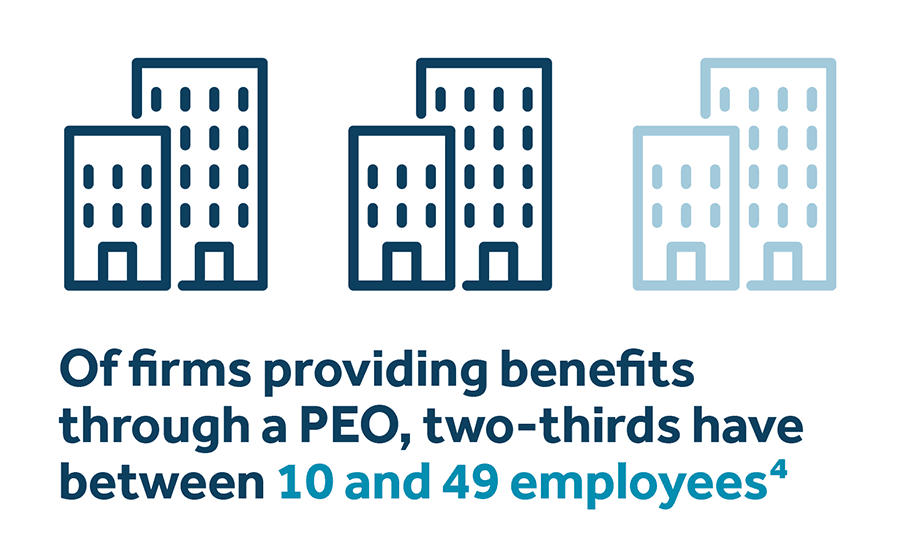
Currently, there are 487 PEOs in the US.5 Together, top tier PEOs, including ADP Totalsource, Insperity, TriNet, and Paychex/Oasis account for half of the PEO industry’s revenue market share.6
While most PEOs offer core benefits like medical, dental, and vision, some are more specialized while others are broadening their product portfolios to include retirement, commuter benefits, and employee assistance programs (EAPs).
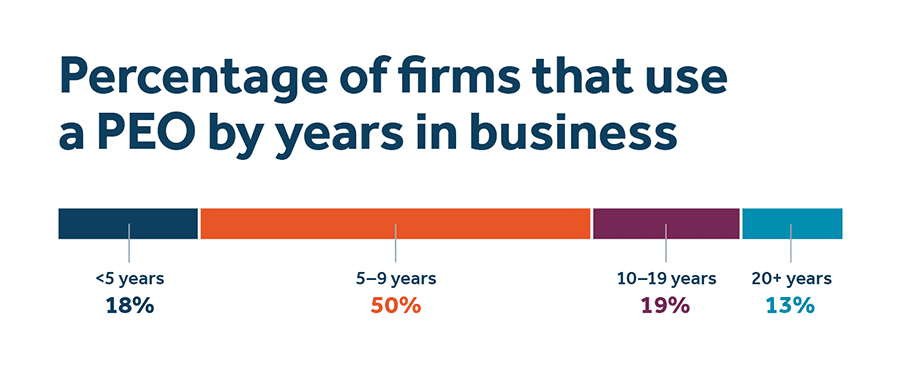
PEO members tend to be young organizations in white-collar industries that joined to access more benefits
Most employers using PEOs are young but not brand new: the largest share of companies using PEOs (50%) have been in business between five and nine years.
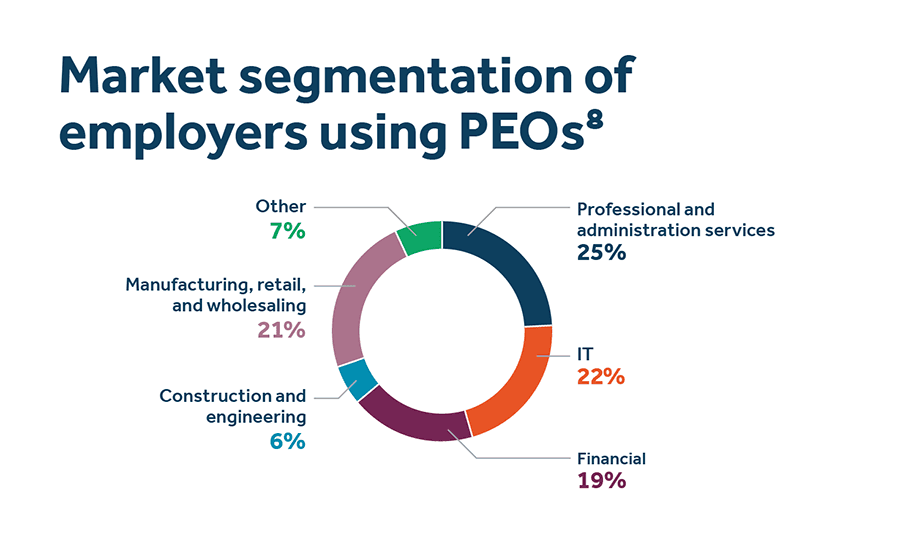
Employers that are members of PEOs are predominately in manufacturing, construction, and professional, scientific, and technical service industries.
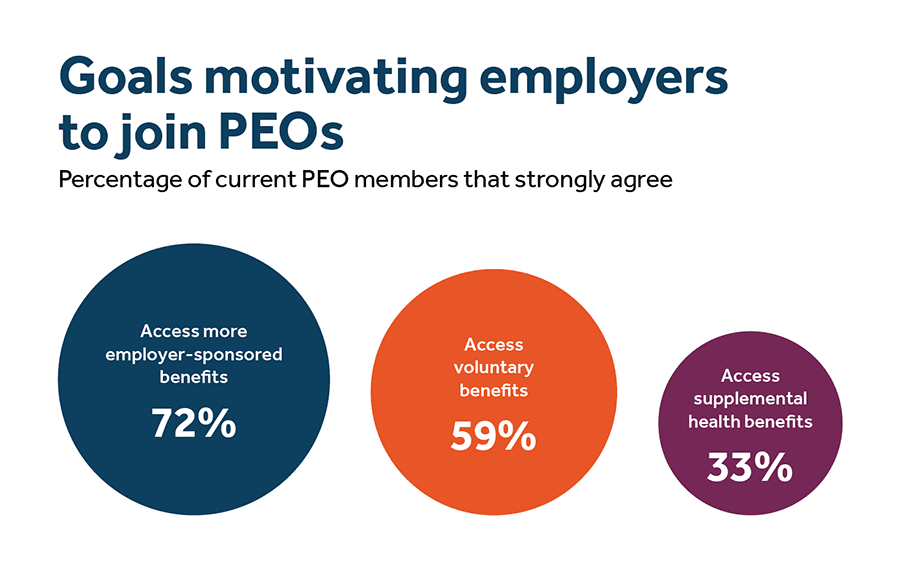
Across industries, the main reason businesses that use a PEO cited for doing so is to access more employer-sponsored benefits to offer their employees.
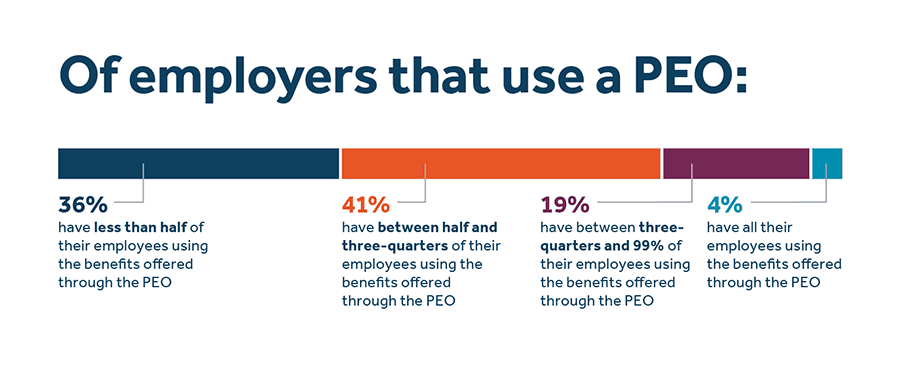
Overall, businesses have been successful in using PEOs to improve access to benefits for their employees. The largest share of employers using a PEO (41%) say between 50–74% of employees in their company use benefits offered through the PEO.
Among employers using a PEO, most (48%) chose the PEO through their own research, while 44% turned to recommendations from HR colleagues, and 40% consulted their brokers. This points to the important role brokers can play in advising clients on HR outsourcing matters.
Employers using PEOs experience more robust business growth, have lower turnover, and are less likely to go out of business
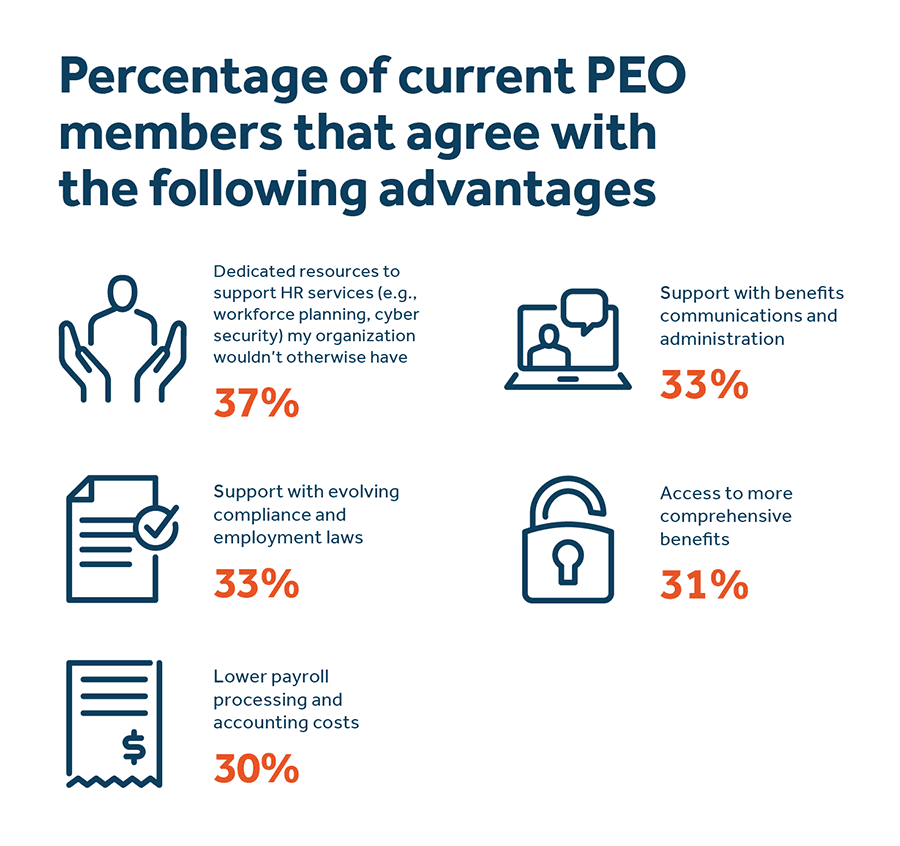
Overall, employers using a PEO are more successful across several measures than employers that don’t. While there are several factors contributing to this, nearly a third of small business owners using a PEO cite the fact that PEOs help remove distractions relating to HR administration, enabling them to focus on business and revenue generation.
More than 8 in 10 employers using a PEO say they’ve experienced significant or moderate growth in the past three years compared to only 5 in 10 of those who don’t.
PEO members are also 12% likelier to project growth during the next three years. As a result, they’re less likely to go out of business. The National Association of Professional Employer Organizations (NAPEO) found that small businesses using PEOs are 50% less likely to go out of business than businesses that don’t belong to one.
Employers using a PEO also do a better job overall retaining their workers.
PEO members have 10% to 14% lower employee turnover.
In an era where top talent is difficult to attract and retain, this is valuable insight for businesses.
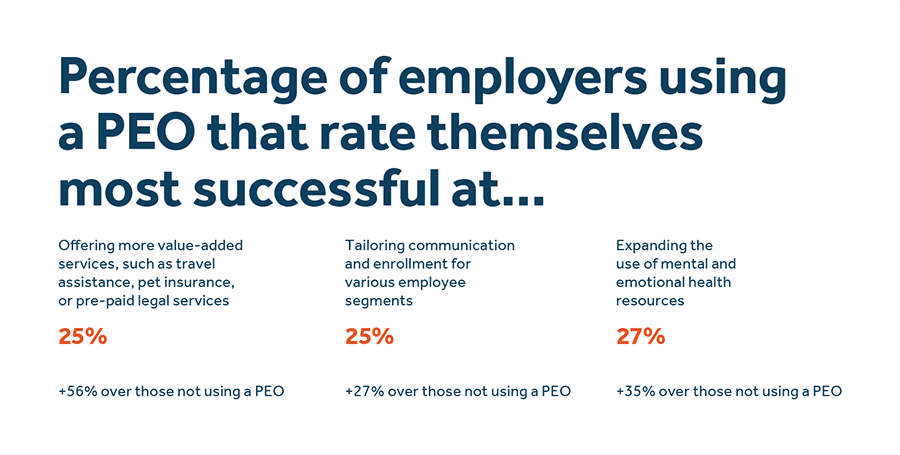
In addition to business success, employers using PEOs experience a range of HR- and benefits-related advantages. Their investment in a PEO pays off, with firms using PEOs rating themselves as more successful than firms not using PEOs across a range of objectives.
Employers using PEOs are more likely to have adapted their benefits and policies to what workers need
Increasingly, workers expect and desire greater empathy and flexibility from their employers. This is due to the pandemic as well as overall shifting attitudes toward work-life balance that began before COVID. As such, businesses that successfully demonstrate to their employees that they care will be successful in attracting and retaining top talent. Our findings show companies that excel in key areas related to employee happiness and loyalty — demonstrating empathy and flexibility, providing support around paid leave, and using technology to support the benefits experience — also are far likelier to be members of PEOs.
Empathy and flexibility
Overall, companies using PEOs have a greater sense of responsibility for their employees’ overall well-being, including their financial wellness. Nearly 8 in 10 (78%) employers using a PEO agree they have a responsibility to ensure the financial preparedness of their workers compared to just 7 in 10 organizations that don’t use a PEO.
They’re also likelier to recognize employees’ desire for greater flexibility in balancing their work-life responsibilities. More than half (52%) of employers that use a PEO say it’s important to offer more flexible hours and telecommuting compared to just 43% of businesses that don’t use a PEO.
Support around paid leave
PEO members also tend to provide more generous paid leave policies to their workforces, especially time off to care for ill or incapacitated family members.
Seven in 10 (71%) PEO members say providing accommodations to employees returning to work following a disability, leave, or serious illness is very important compared to 58% of employers that don’t use a PEO. They also prioritize providing support for employees who are caregivers.
Seventy percent of businesses using a PEO say they provided support for employees with caregiving responsibilities versus 53% of those that don’t use a PEO.
Using technology to improve the employee benefits experience
Employers that use PEOs are far likelier (70%) than those that don’t (61%) to prioritize doing a better job of helping workers make better benefits decisions. One way they do this is by providing a more digital enrollment process.
They also prioritize finding HR and benefits administration technology that includes the ability to integrate with decision support tools to help employees make enrollment decisions. Nearly three-quarters of businesses that use a PEO (72%) say it’s very important to integrate with decision support tools compared to only 57% of businesses that don’t use a PEO.

Nearly three-quarters of employers using a PEO prioritize creating a culture of well-being
In a similar vein, employers that use PEOs are far likelier to prioritize workers’ mental health and recognize the importance of creating a caring work culture.
While there’s been a trend in the past few years overall toward providing more comprehensive mental health support in the workplace, it’s especially pronounced among employers who are PEO members.
They’re also likelier to provide a wider range of mental health resources than organizations that don’t use a PEO. For example, PEO members are 56% likelier to offer a behavioral health program than businesses that don’t use one, 49% more likely to offer an employee assistance program (EAP), and 62% more likely to offer employee support groups.
Their investment pays off, as employers using PEOs report significantly better overall workforce mental health than employers that don’t.
Seventy-five percent of employers using a PEO rate their workforce’s overall mental health as “very good” or “excellent” compared to only 60% of those not using a PEO.
Employers that use PEOs also place a higher priority overall on creating an inclusive and community-oriented workplace culture. Seven in 10 employers using a PEO say they provide support and accommodations for employees with physical disabilities compared to 6 in 10 that don’t. Also, two-thirds of businesses using a PEO say they encourage employees’ engagement in social responsibility compared to just over half (51%) of those not using one.

Is working with a PEO right for your business?
Depending on your business' unique needs, working with a PEO may be a helpful strategy. Here are some takeaways based on the business and attitudinal characteristics of firms that use PEOs to keep in mind:
For small (<100 employees) and relatively young (roughly 5-10 years old) companies, PEOs can help compete with larger firms when it comes to offering competitive benefits.
Businesses that manage complex workforces (for example, employees in multiple states or that employ a significant number of part-time and/or consultant workers) may find PEOs helpful as they help streamline benefits administration.
Most businesses using PEOs are in the financial, IT, and professional/administrative services industries. Firms in industries such as construction can help differentiate themselves by joining a PEO to offer their workforces a greater range of benefits.
PEO membership is correlated with more progressive paid leave and flexible work policies, suggesting the convenience and simplification of benefits management that comes with using a PEO enables the businesses that do to focus on more strategic HR initiatives.
