Ratings
We’re proud of being one of the most highly rated companies in the industry, earning the trust of our policyholders, investors, and partners.1
As one of the largest mutual insurance companies in the country, Guardian has the benefit of aligning our interests to our policyholders and customers. Our history of returning a portion of our profits through a dividend demonstrates our financial strength and commitment to our customers since 1860.

Aa1
High Quality
2 of 21
Moody’s Investors Service
A++
Superior
1 of 15
A.M. Best Company
AA+
Very Strong
2 of 20
Standard & Poor’s
100
Out of 100
Comdex*
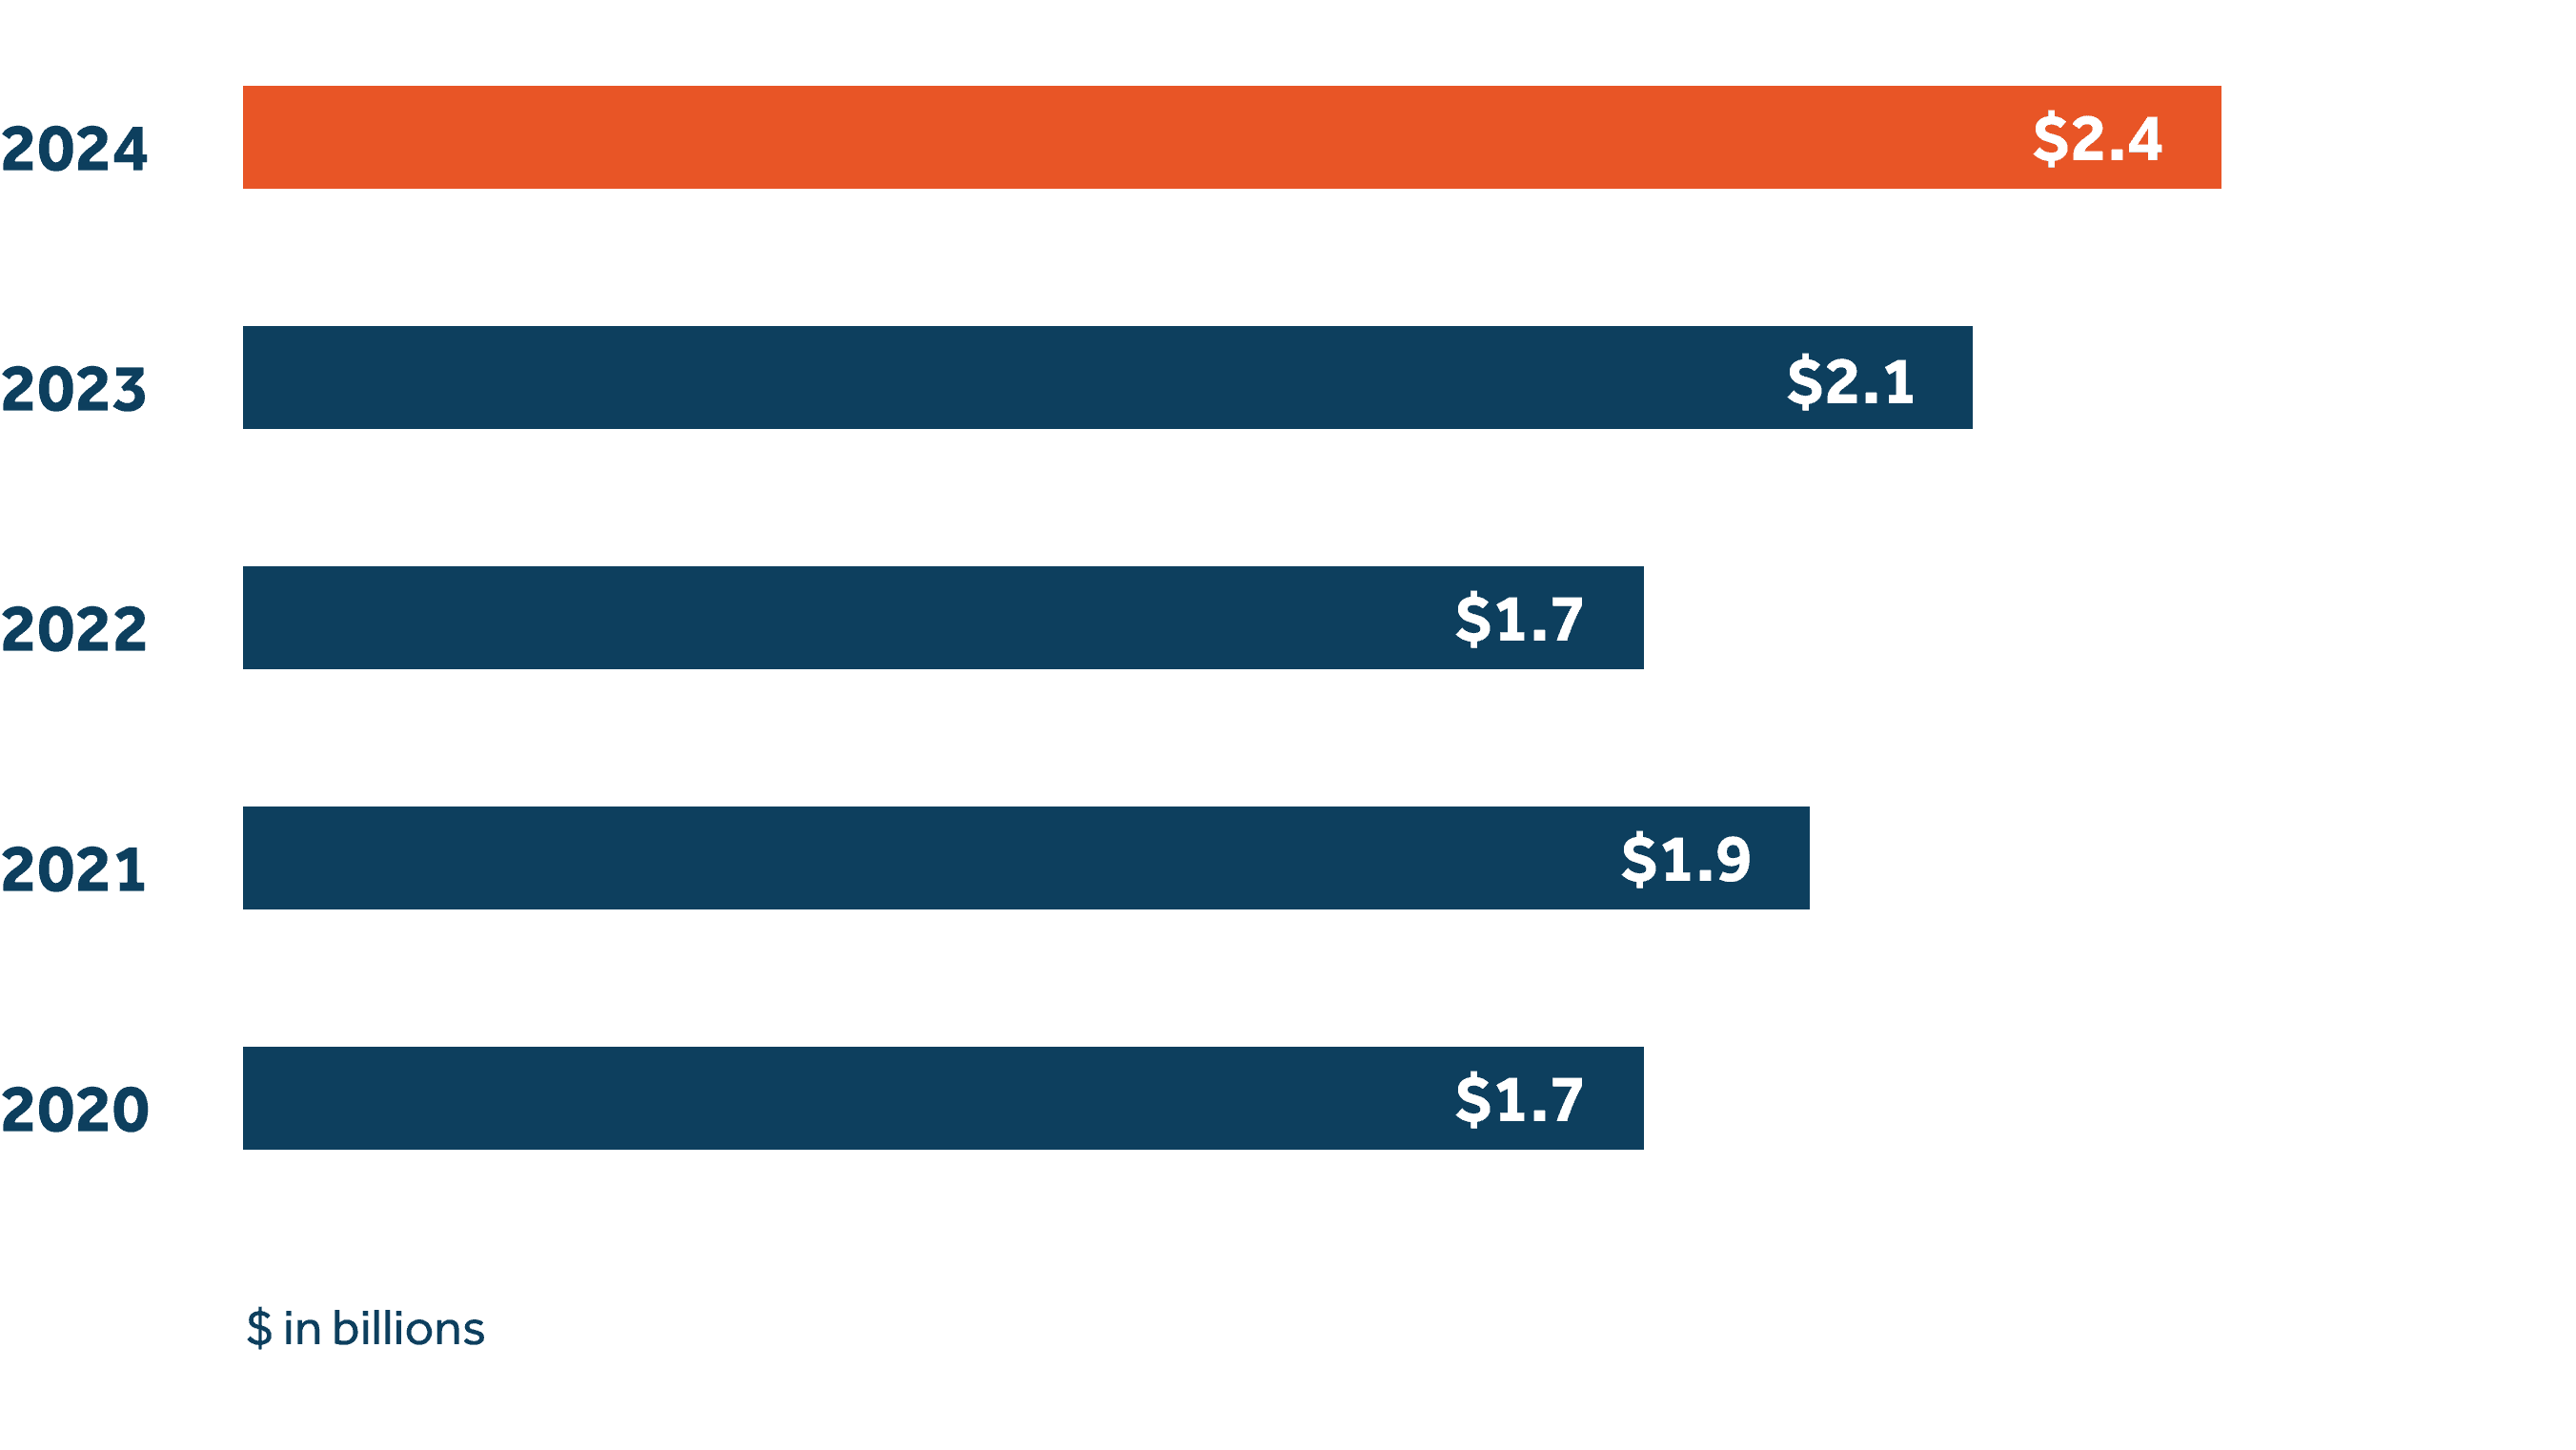
$2.4 billion
Achieved record operating income of $2.4 billion
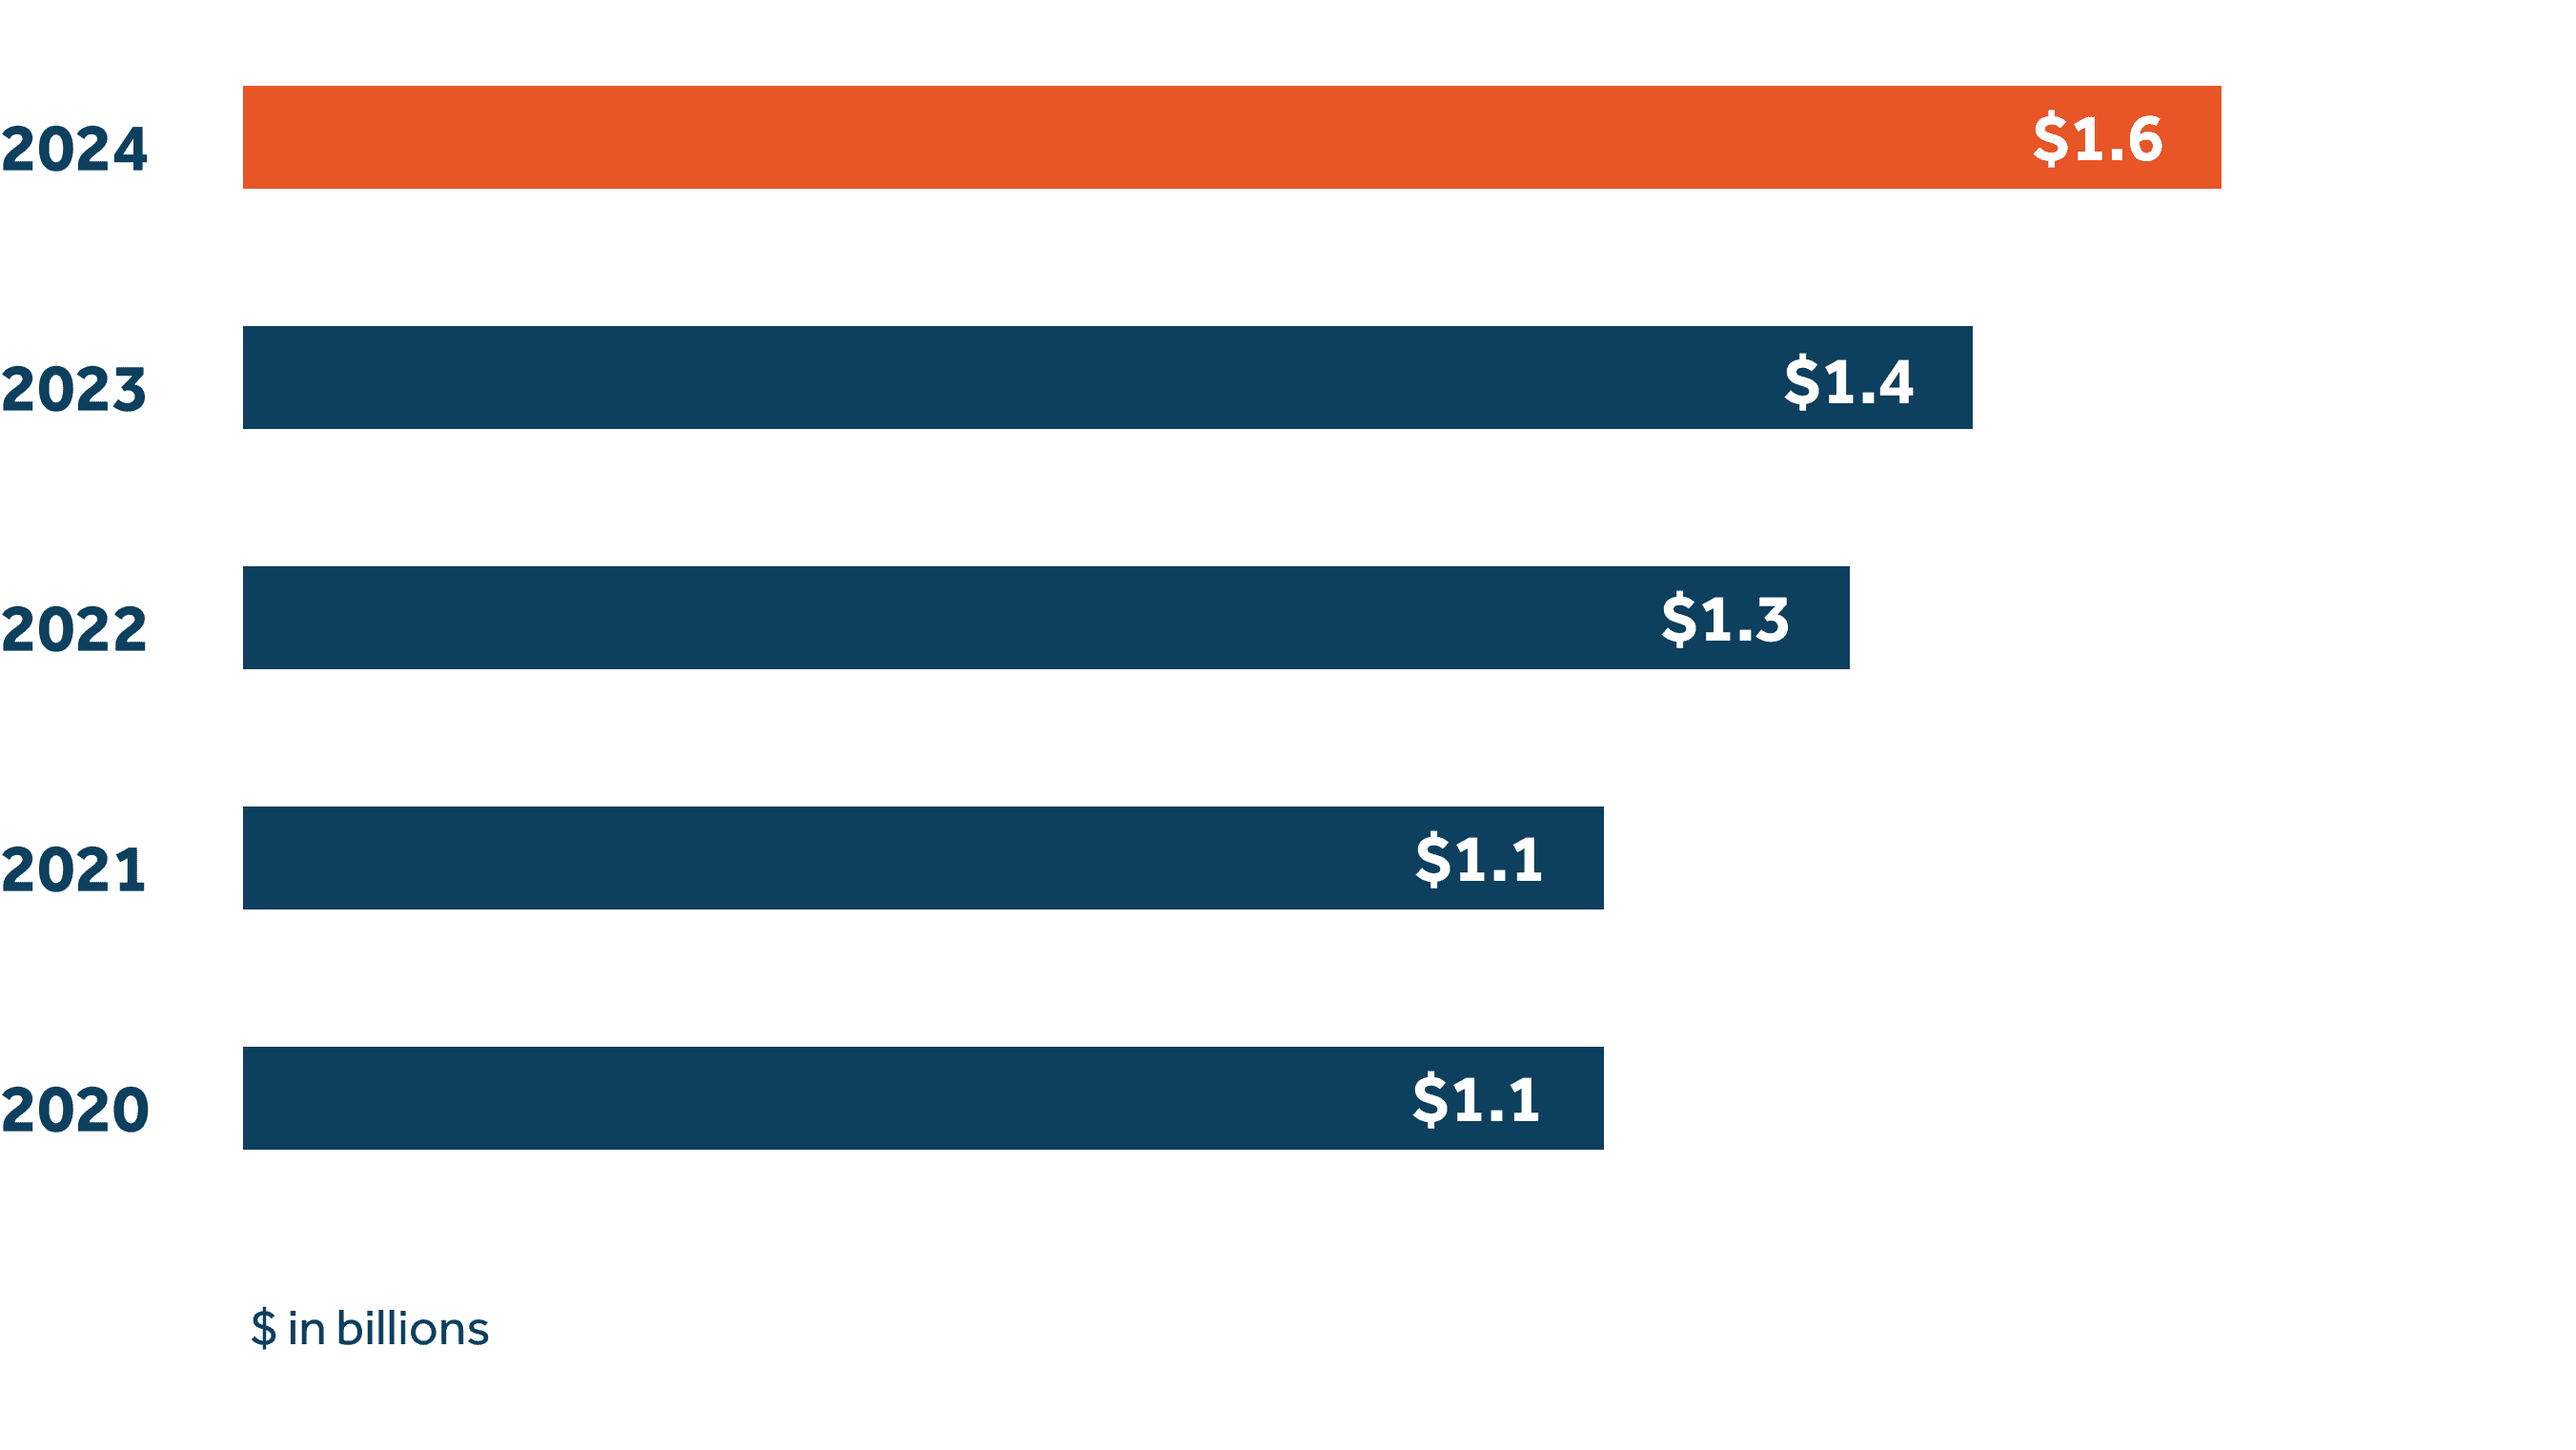
$1.6 billion
Delivered a record 2024 dividend of $1.6 billion to our participating policyholders, an increase of 14% from 2023
$13.4 billion
Achieved strong premium growth of 5%, with record sales in our Group Benefits and Individual Markets businesses
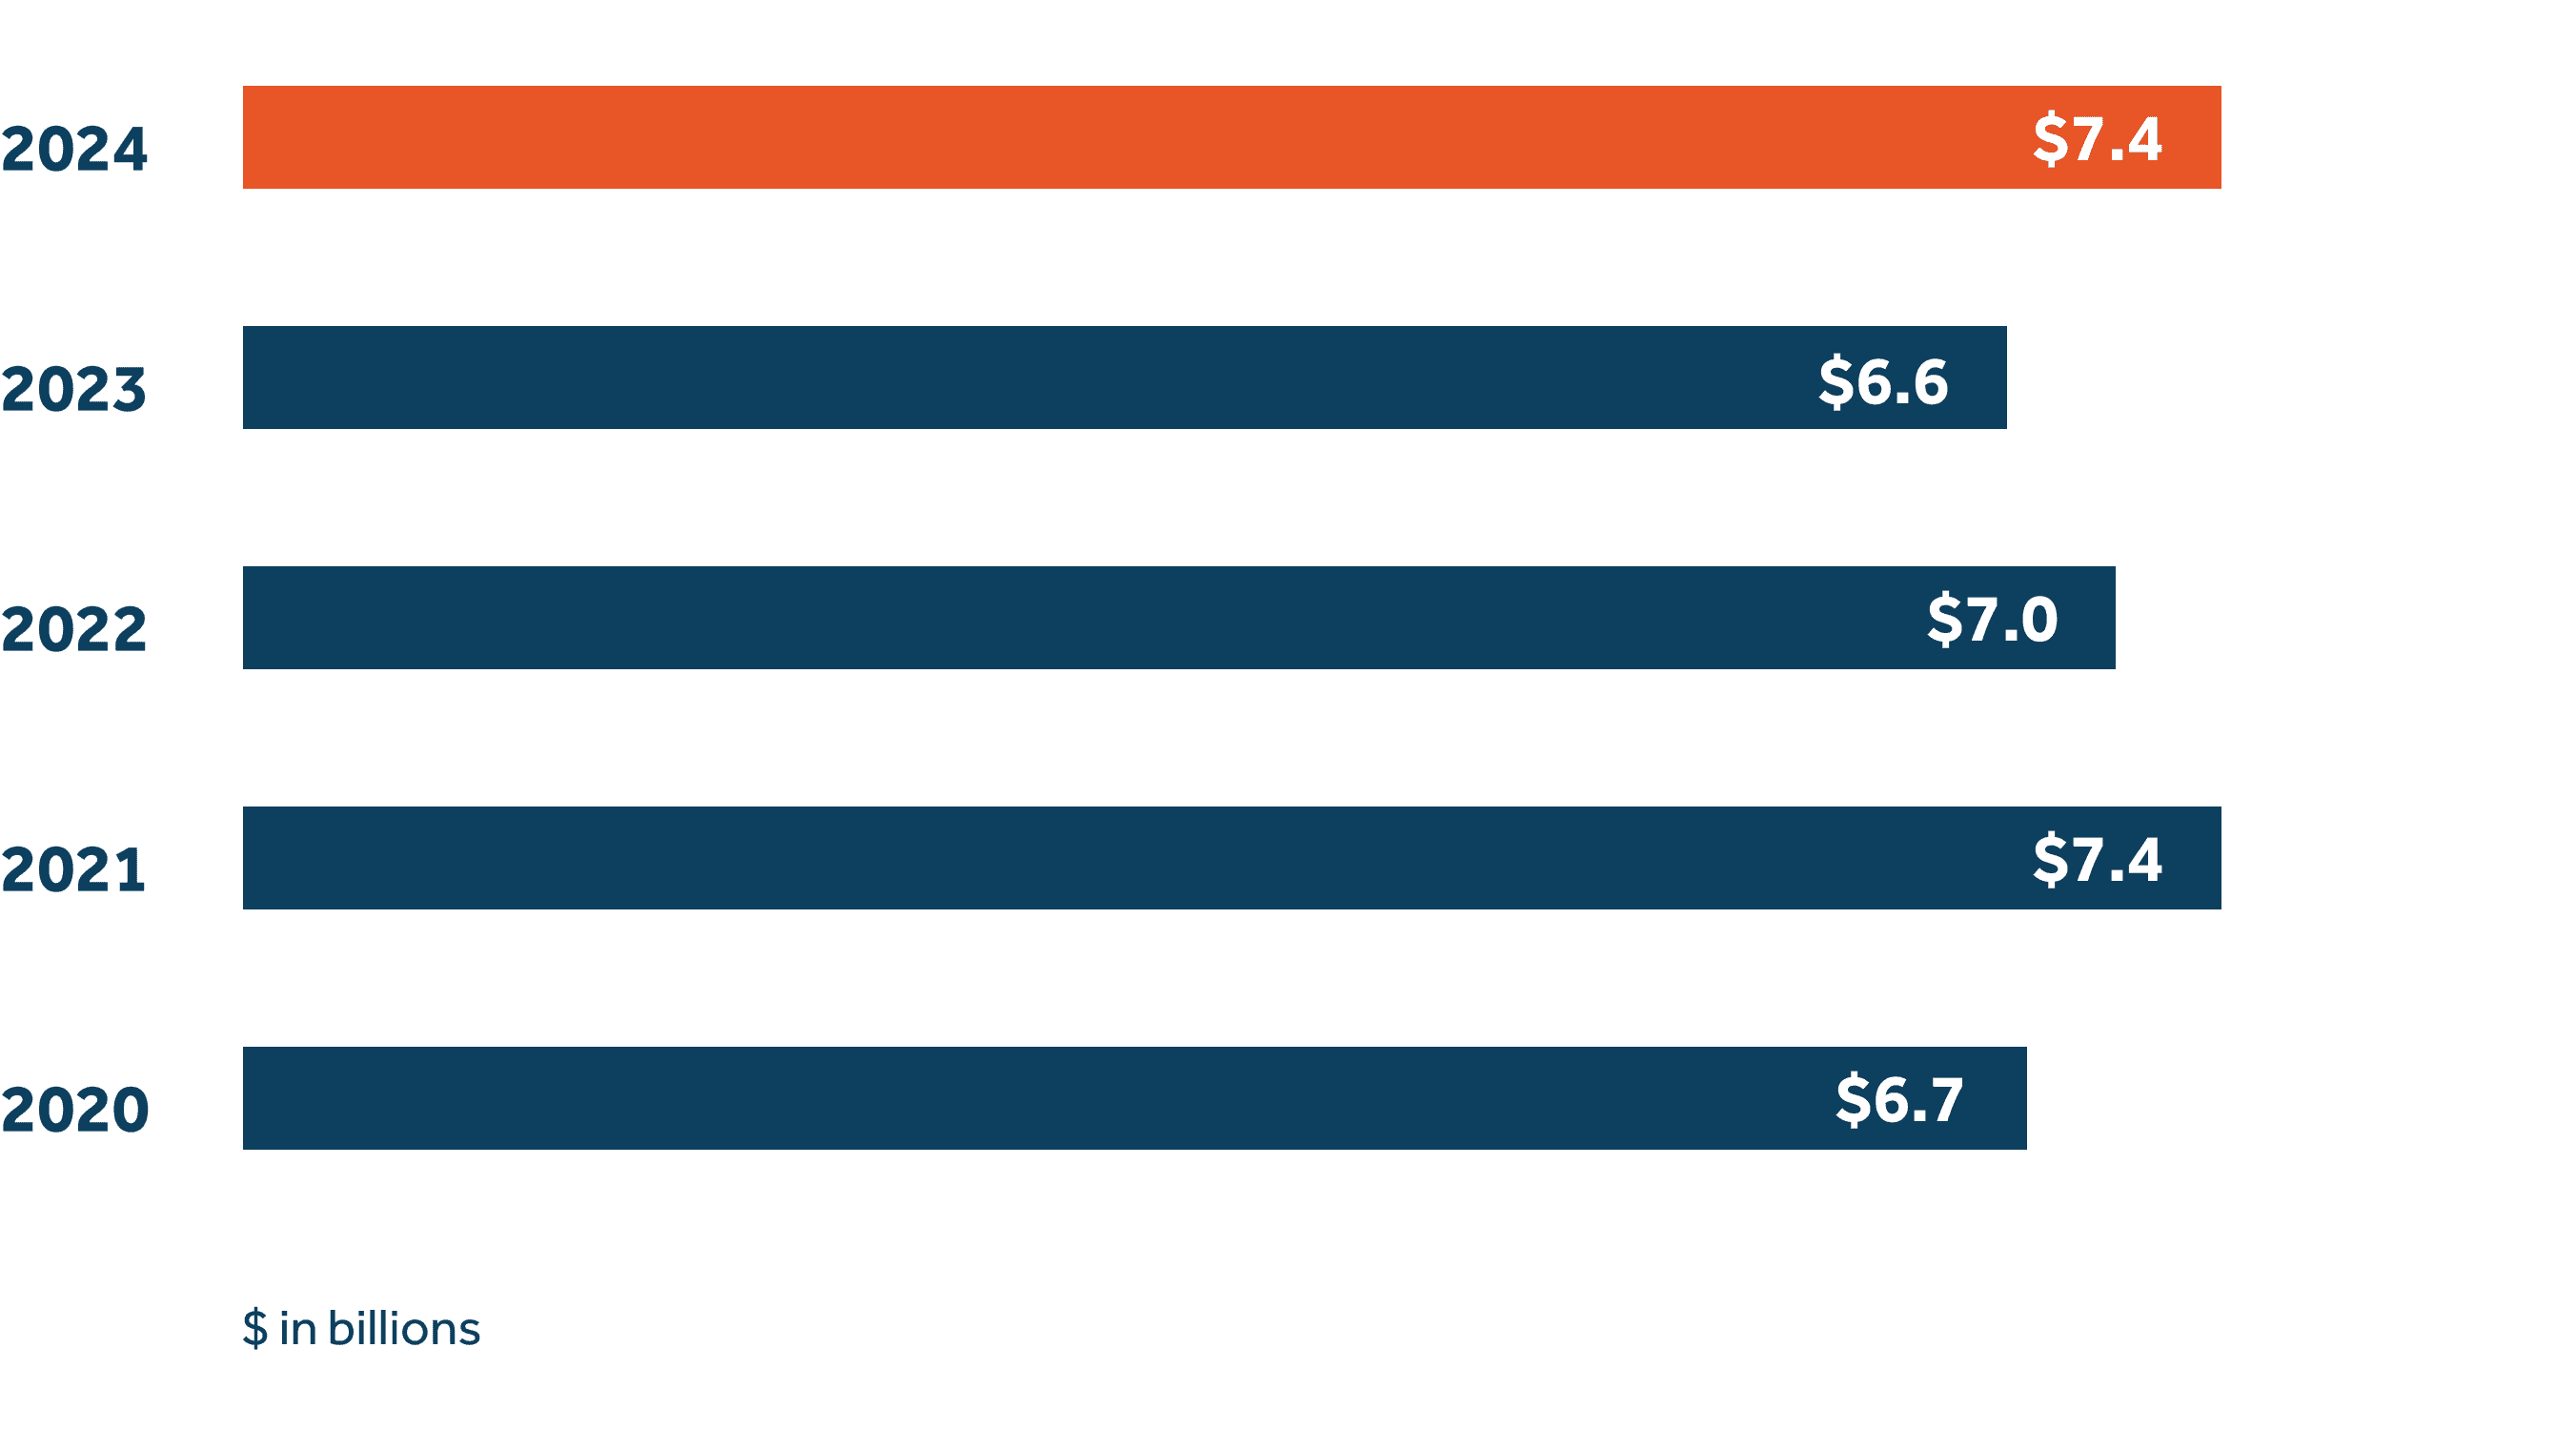
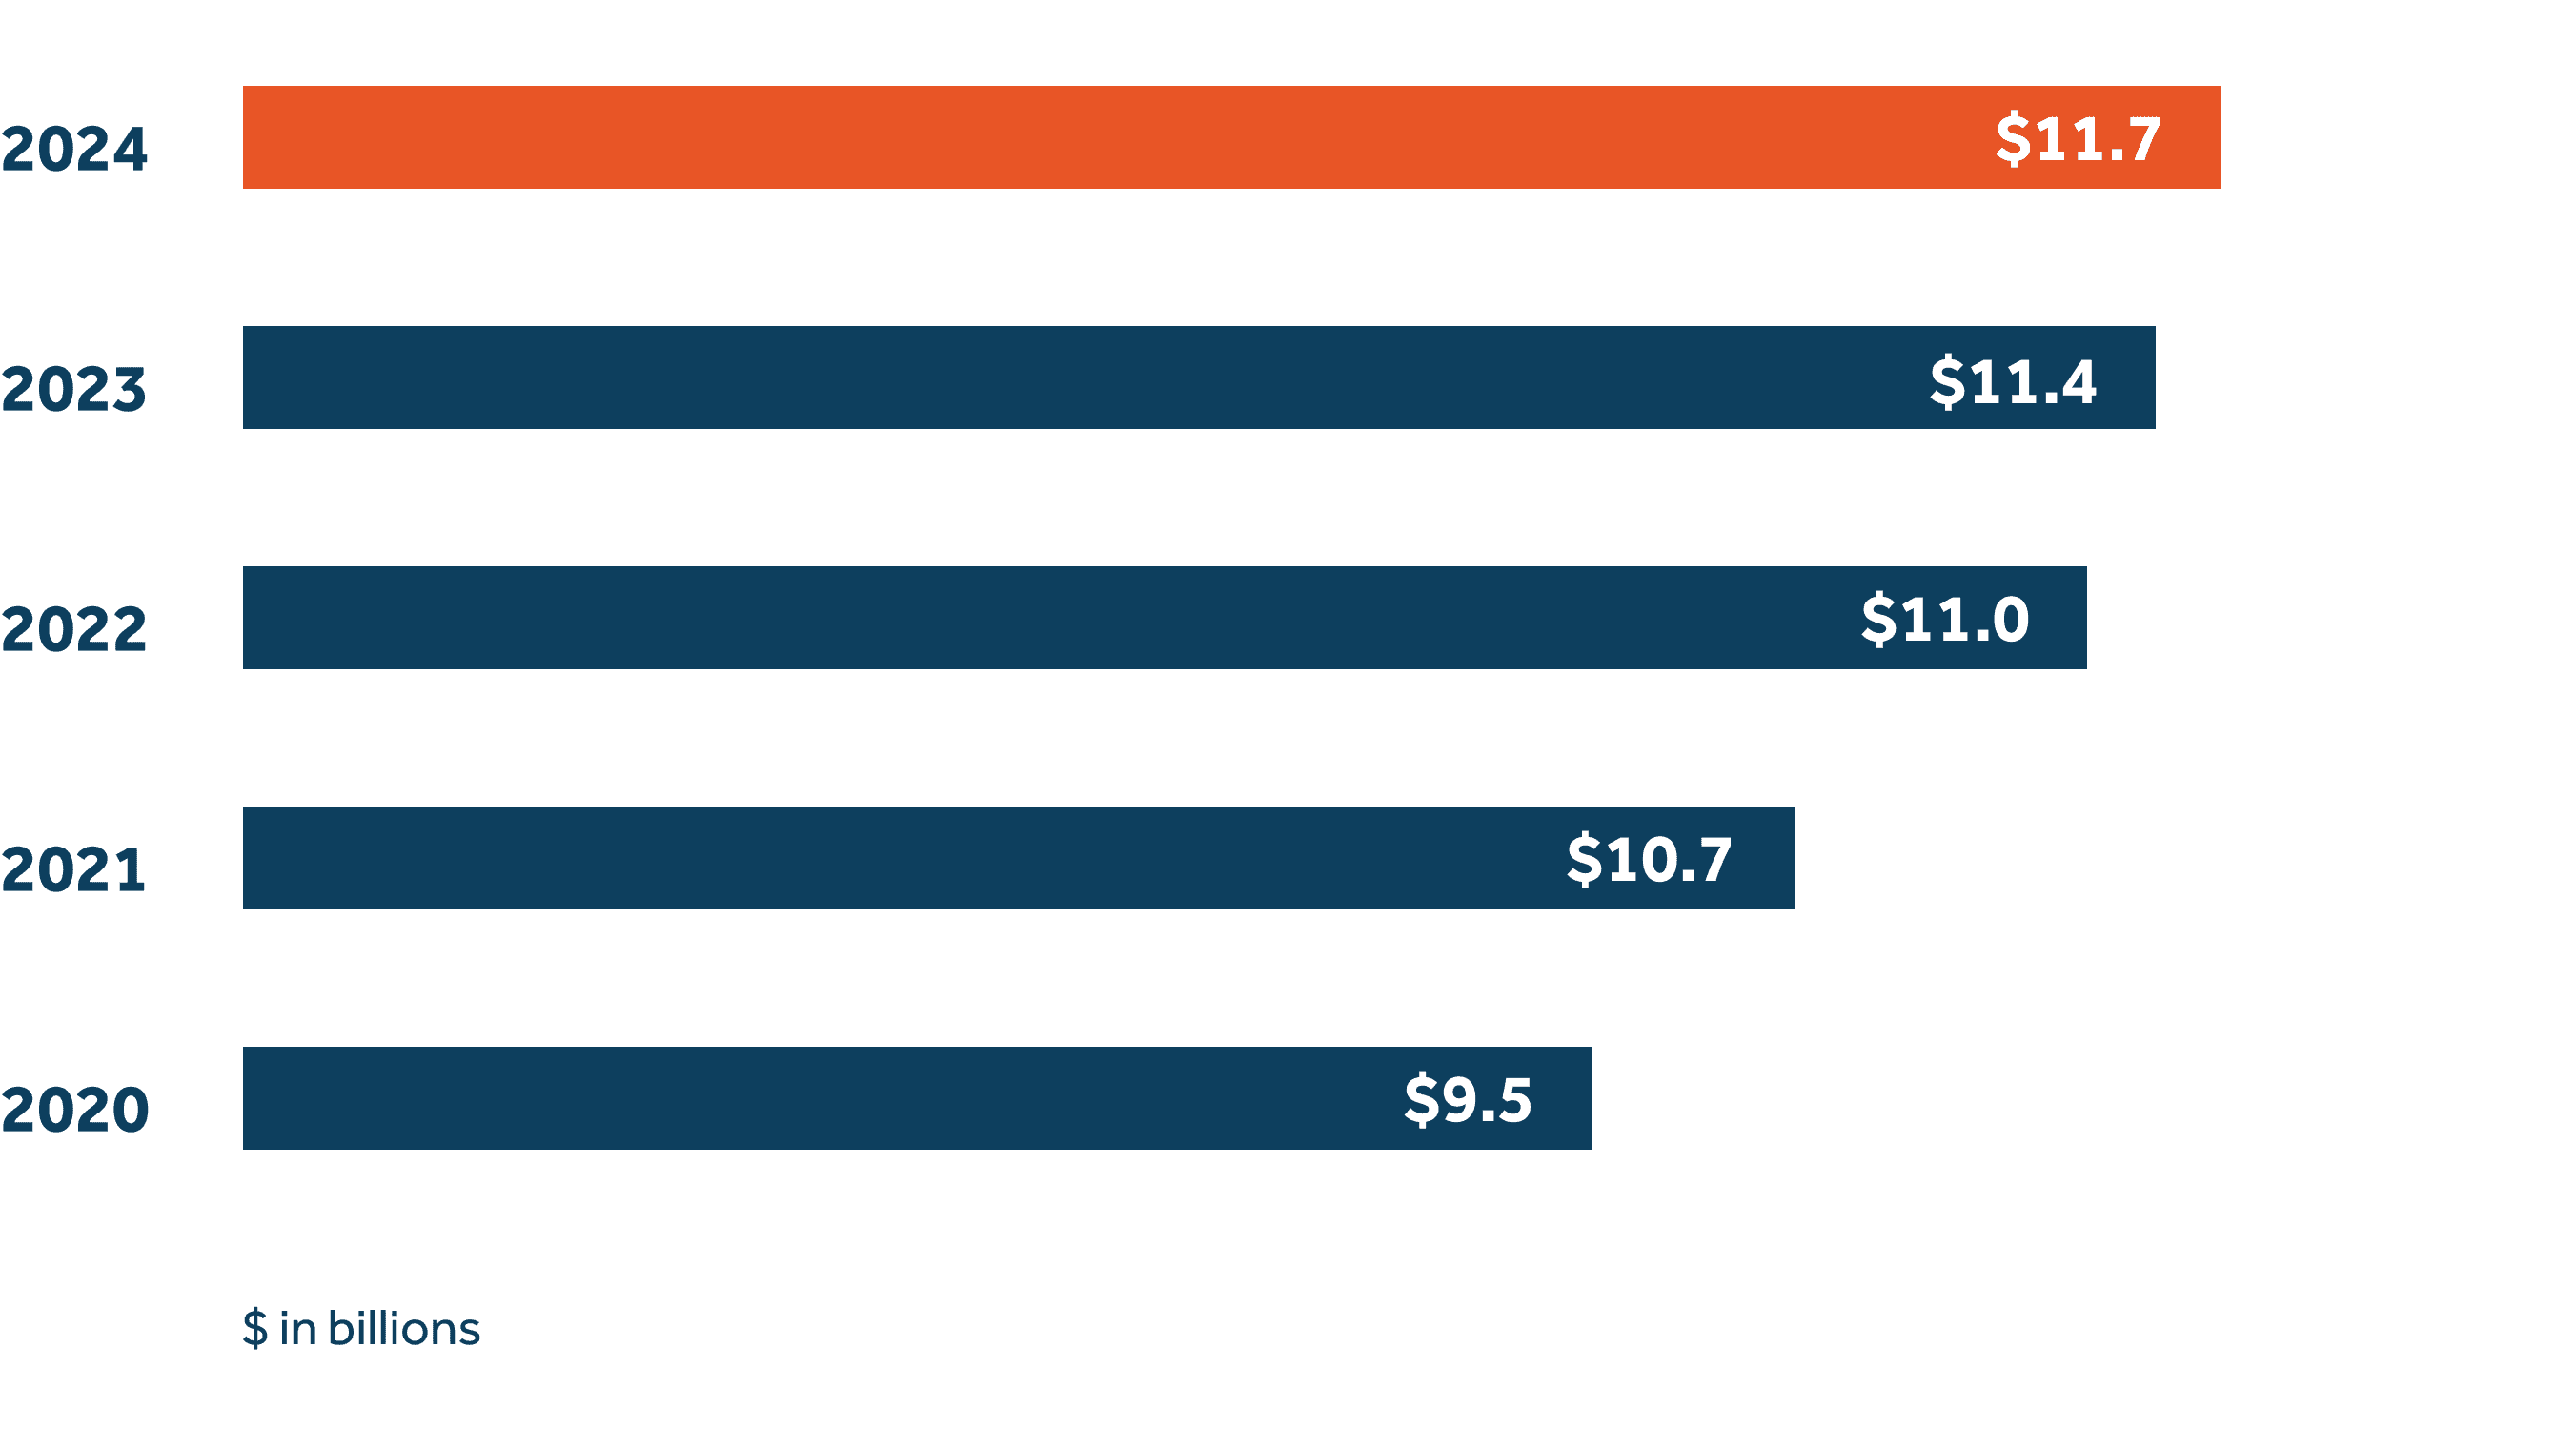
We surpassed an operating income of more than $2.4 billion, an all-time record for Guardian, and maintained more than $11 billion in capital. This was driven by robust investment returns, sound underwriting, and prudent expense management.
As of December 31, 2024
Investments
Guardian’s investments have always been a cornerstone of our business and an important contributor to our strong financial ratings. Our successful track record is a result of an investment philosophy centered on delivering long-term value for our policyholders, which includes:
Focusing on the breadth and diversification of our investment portfolio.
Constructing a high-quality portfolio to withstand unpredictable economic cycles.
Operating with strong risk discipline.
We take pride in continually striving for superior risk-adjusted returns while ensuring we deliver on our financial promises.
Asset class allocation — December 31, 2024
Statement value | $ millions | % of invested assets |
|---|---|---|
Bondsi | 52,866 | 66.4% |
Commercial mortgagesii | 8,213 | 10.3% |
Policy loans | 6,069 | 7.6% |
Private & real estate equity | 4,144 | 5.2% |
Affiliates & subsidiaries | 2,082 | 2.6% |
Cash, short-term, & other invested assets | 6,192 | 7.8% |
Total invested assetsiii | 79,566 | 100% |
1The ratings of The Guardian Life Insurance Company of America® (Guardian) quoted in this report are as of December 31, 2024 and are subject to change. The ratings earned by Guardian do not apply to the investments issued by The Guardian Insurance & Annuity Company, Inc. (GIAC) or offered through Park Avenue Securities LLC (PAS). Rankings refer to Guardian’s standing within the range of possible ratings offered by each agency.
*Comdex is not a rating but a composite of all ratings that a company has received from the major ratings agencies (A.M. Best, Fitch, Moody’s, and Standard & Poor’s). Comdex represents a company’s percentile standing, on a scale of 1 to 100 (with 100 being the best), in 2025 in relation to other companies that have been rated by the major agencies.
2Dividends are not guaranteed. They are declared annually by Guardian's Board of Directors. The total dividend calculation includes mortality experience and expense management as well as investment results.
3Certain amounts from 2023 have been reclassified to conform to the current year presentation.
Other legal information:
Financial information concerning Guardian as of December 31, 2024, on a statutory basis: Admitted assets = $86.8 billion; liabilities = $77.5 billion (including $60.7 billion of reserves); and surplus = $9.3 billion.
Financial information concerning GIAC as of December 31, 2024, on a statutory basis: Admitted assets = $10.6 billion; liabilities = $10.0 billion (including $3.5 billion of reserves); and capital and surplus = $0.6 billion.
Financial information for Berkshire Life Insurance Company of America as of December 31, 2024, on a statutory basis: Admitted assets = $5.5 billion; liabilities = $5.3 billion (including $1.1 billion in reserves); and capital and surplus = $0.2 billion.
i Total bonds consist of 94% investment grade and 6% below investment grade public and private debt but excludes surplus note debentures classified as Schedule BA invested assets, commercial mortgages, and preferred stock.
ii Includes commercial mortgage loans and mortgage debt funds.
iii Presentation of invested assets is a condensed view which will not align to the audited statutory financial statements.
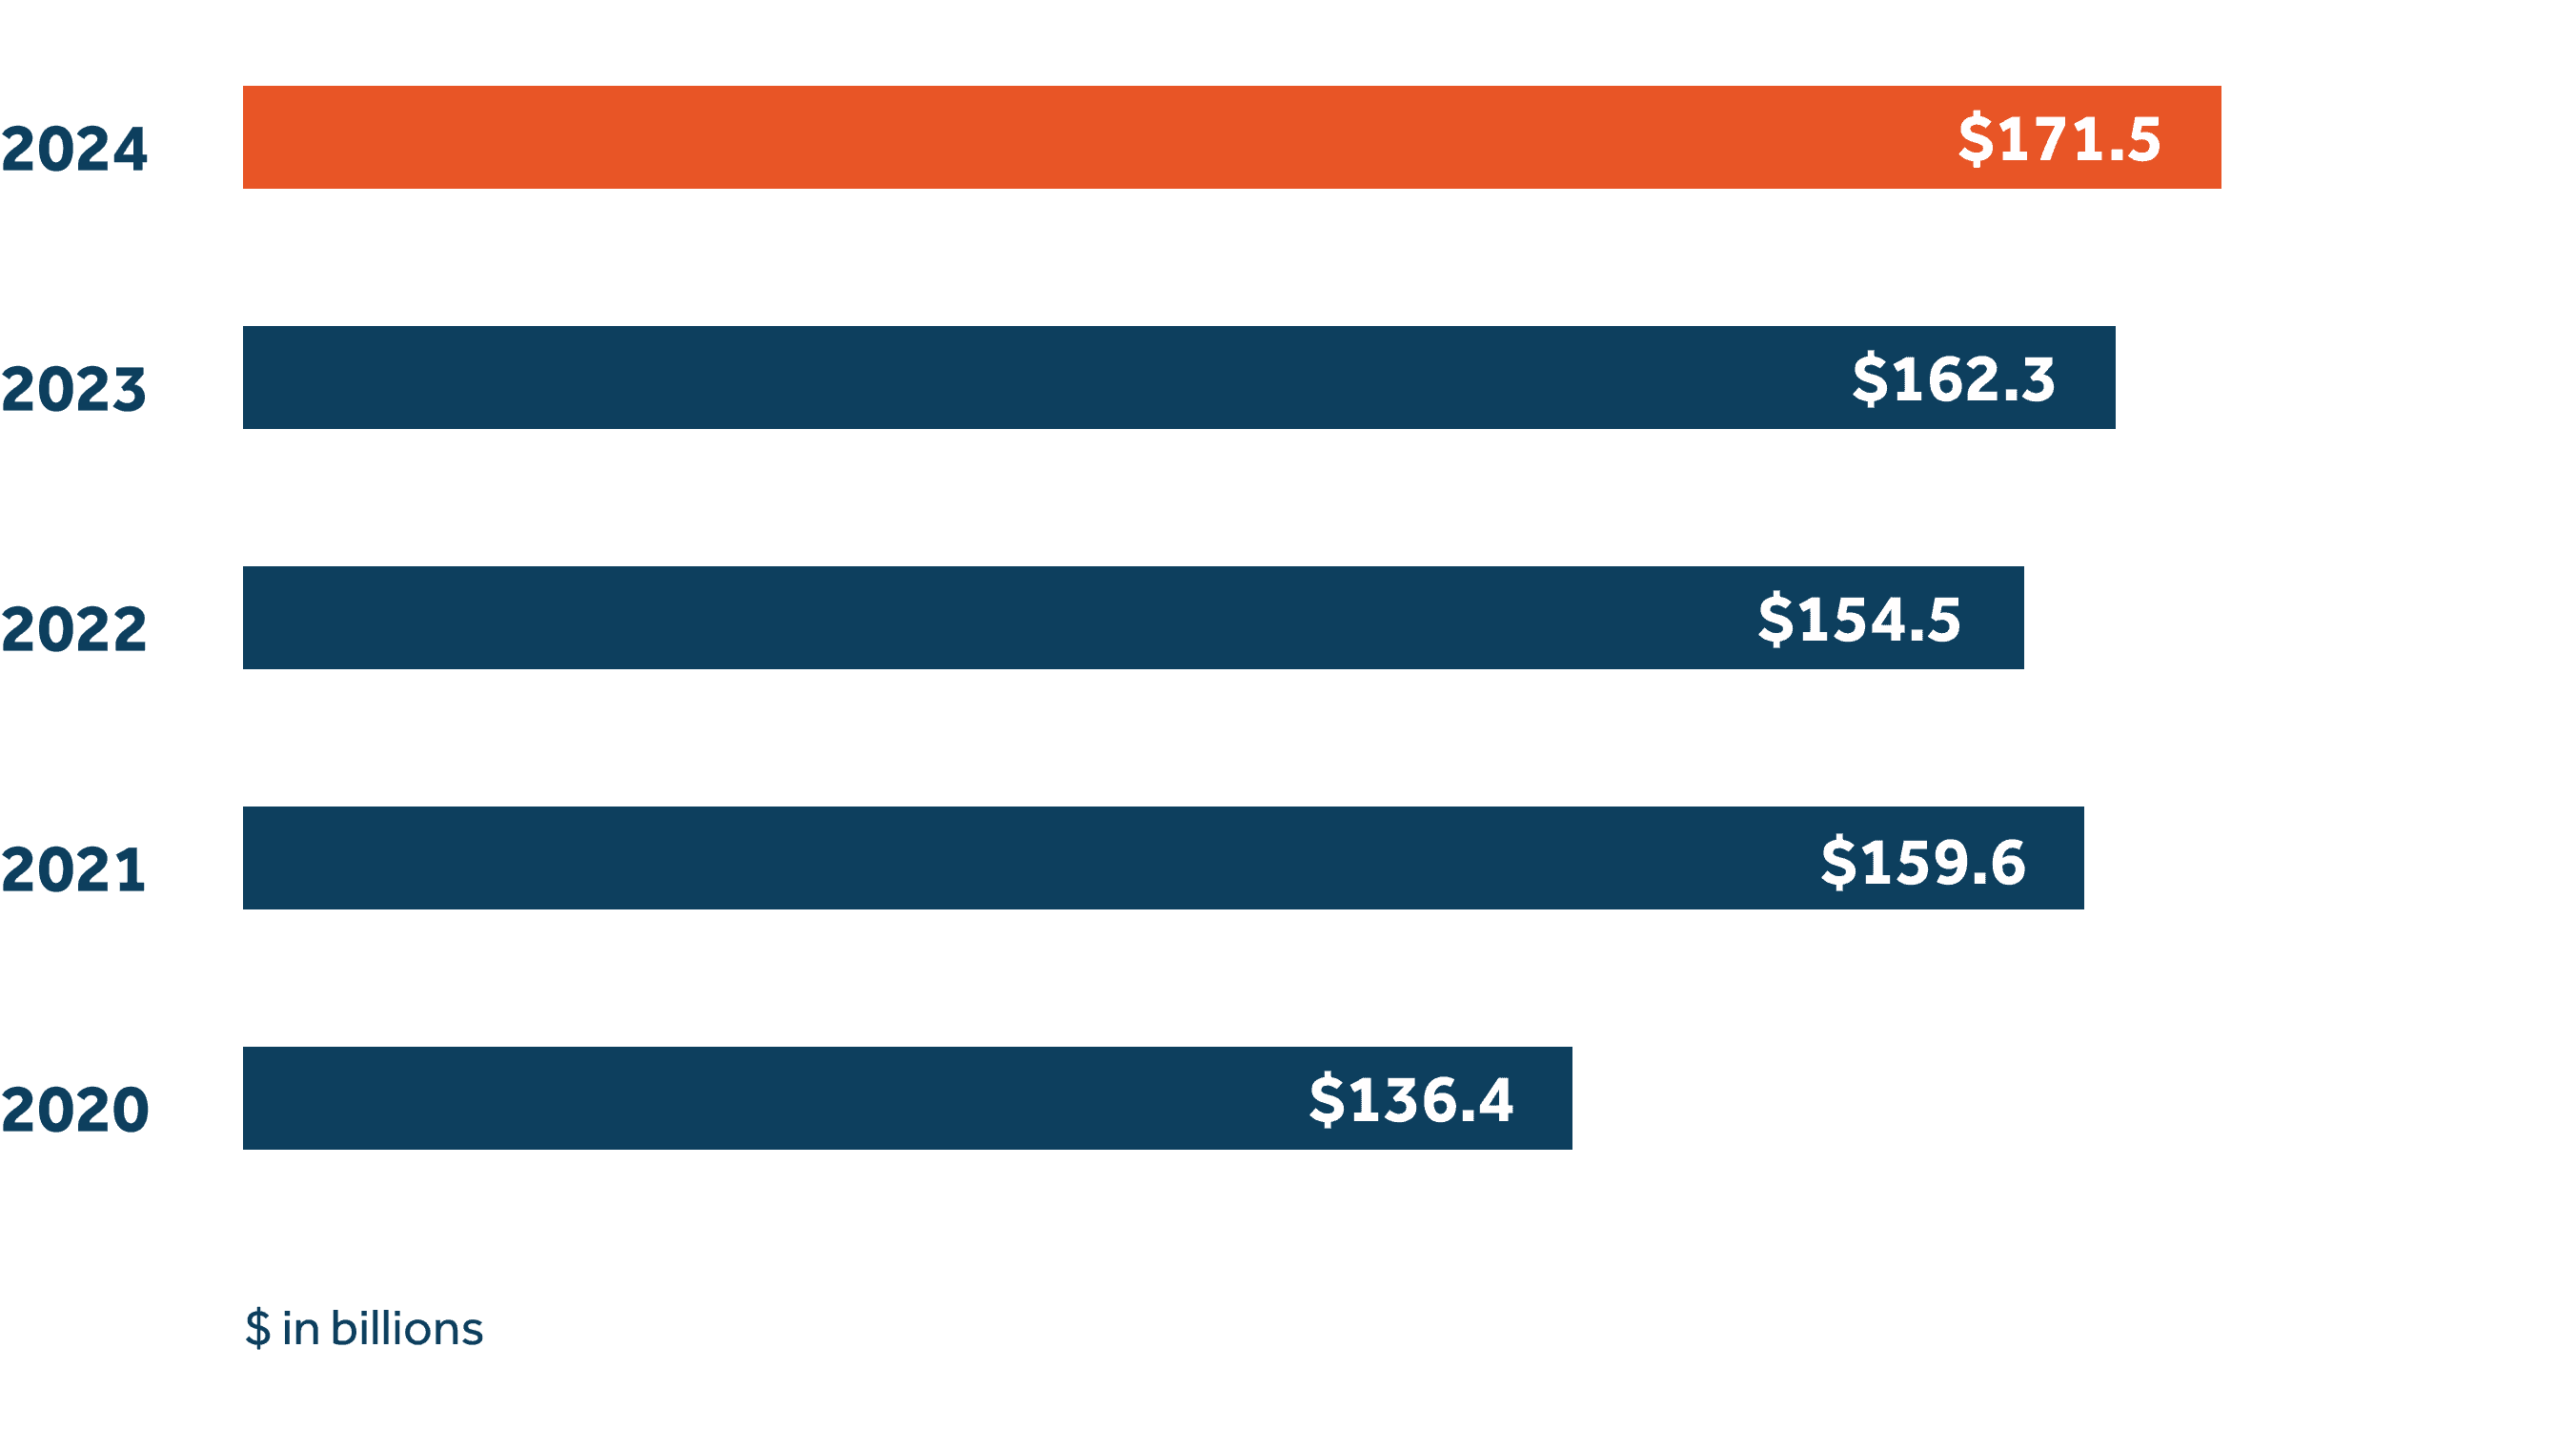


The following condensed financial statements of The Guardian Life Insurance Company of America have been derived from audited statutory financial statements, which are available upon request.3
For the year ended December 31 (in millions) | 2024 | 2023 |
|---|---|---|
Revenues | no | no |
Premiums, annuity considerations, and fund deposits | $10,516 | $10,115 |
Net investment income | 3,435 | 2,997 |
Other income | 552 | 359 |
Total revenue | 14,503 | 13,471 |
| no | no | no |
Benefits and expenses | no | no |
Benefit payments to policyholders and beneficiaries | 6,232 | 5,401 |
Net increase to policy benefit reserves | 2,686 | 2,966 |
Commissions and operating expenses | 3,367 | 3,151 |
Total benefits and expenses | 12,285 | 11,518 |
Gain from operations before policyholder dividends and taxes | 2,218 | 1,953 |
Policyholder dividends | (1,566) | (1,382) |
Gain from operations before taxes and realized capital losses | 652 | 571 |
Income tax expense | (114) | (90) |
Net realized capital losses | (357) | (119) |
Net income | $181 | $362 |
As of December 31 (in millions) | 2024 | 2023 | |
|---|---|---|---|
Admitted assets | no | no | no |
Bonds | $52,866 | no | $52,093 |
Unaffiliated common and preferred stocks | 297 | no | 107 |
Investments in affiliates | 1,073 | no | 1,095 |
Mortgage loans | 7,462 | no | 7,030 |
Private and real estate equity | 4,875 | no | 4,389 |
Policy loans | 6,069 | no | 5,106 |
Receivable for securities, other invested assets, and derivatives | 4,176 | no | 2,391 |
Cash and short-term investments | 2,748 | no | 1,191 |
Total invested assets | 79,566 | no | 73,402 |
Premiums deferred and uncollected | 1,226 | no | 1,213 |
Reinsurance recoverable from affiliate | 4,001 | no | 3,777 |
Other assets | 2,032 | no | 1,874 |
Total admitted assets | $86,825 | no | $80,266 |
| no | no | no | no |
Liabilities and surplus | no | no | no |
Reserves for policy benefits | 60,661 | no | 57,975 |
Policyholder dividends payable and other contract liabilities | 10,102 | no | 8,233 |
Interest maintenance reserve | 0 | no | 227 |
General expenses due or accrued | 1,184 | no | 1,150 |
Asset valuation reserve | 1,567 | no | 1,492 |
Other liabilities | 4,023 | no | 2,117 |
Total liabilities | 77,537 | no | 71,194 |
| no | no | no | no |
Policyholders' surplus | 7,786 | no | 7,571 |
Surplus notes | 1,502 | no | 1,501 |
Total liabilities and surplus | $86,825 | no | $80,266 |